Analysing a Decade of Github Stars
I assembled and analysed a decade of timestamped Github stars, in order to retrospectively analyse large IT trends. Stars are a rough proxy for popularity of a repository. Like any proxy measure, it is flawed. But it’s sufficient for a rough trend analysis. An additional caveat is that tech represented on Github is a non-representative subset of IT tech overall.
The Data
I downloaded timestamped Github stars for each repository with more than 4k stars, corresponding to the top 5k repositories ordered by star count on 2020-06-07.
The Metric
Simply looking at total stars over time obscures trends, so we look at stars gained over a given range of time. I’m interested in trends over 6-24 month periods, so I chose a range of 1 year. For each repository, I computed the stars gained over the last year, for each month since repository creation.
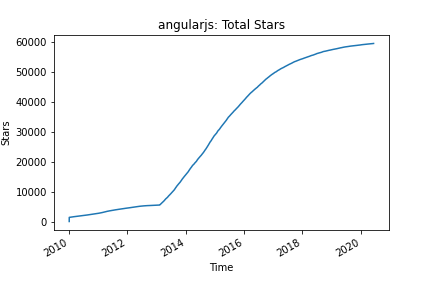
As an example, let’s look at angular.js. At around 60k stars, it’s one of the most-starred repos on Github.
From the total number of stars over time it is hard to tell when angular.js was at its peak:
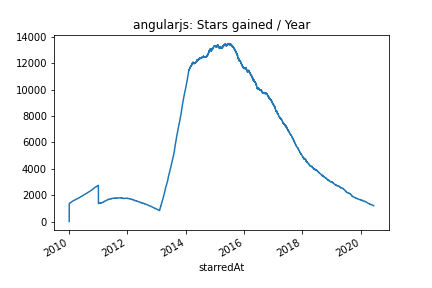
Looking at stars gained per year shows us that angular was most popular around 2013-2015 (until angular2 appeared)
Bar Chart Races
We can visualize the 1 year star gain as a bar chart race. I used Flourish Studio for this.
gfycatOne thing that stands out is the popularity of educational, informational, or political repos in recent years. This includes the two highest-starred repositories, FreeCodeCamp and 996.ICU (for protesting against excessive working hours in Chinese tech companies). Since I’m more interested in concrete pieces of tech here, I filtered out many non-tech repositories, using a semi-manually created list (you can filter out pretty much any repository that contains “awesome-”, “tutorial”, “guide”, “cheatsheet”, and a few others).
This gives us the following visualization:
gfycat
To dive deeper, I created visualizations for specific programming languages. I use the primary language as given by Github in June 2020 for each repository for this. This means switches in programming languages during a repositories lifetime are not represented. Also, in multi-language repositories, Github’s definition of the primary language may deviate from human perspective.
JavaScript Universe / Frontend
I filtered to repositories where the primary language, as given by Github, is JavaScript, Typescript, Dart, CoffeeScript, CSS, or HTML.
This gives the following bar chart race:
gfycat
We can see the popularity of Bootstrap in the first half of the decade. jQuery is popular from 2009 to 2012. 2013-2014 is dominated by angularjs, followed in 2015 by react, angular2, and then vue, and recently flutter and svelte. Vue seems to be especially popular in China; there is a number of frameworks for integrating Vue with WeChat, Alibaba, etc.
Python
gfycat
The start of the decade is dominated by web-backend related stuff like flask, Tornado, and Django. From 2016/2017, we see a lot of deep learning repos popping up. Some more noteable appearances at the top of the list: requests, an elegant HTTP library, thefuck, an application that corrects your console commands, certbot for automatically getting HTTPS certificates, superset, a business intelligence application.
Below are visualizations for a few more languages which I have not used much, so I won’t comment a lot.
Java
gfycat
Can’t comment much on Java, but it’s impressive that elastic search is in the top 15 for the whole decade.
Close-to-the-metal
This includes C++, C, Objective-C, Swift, and Rust.
gfycat
A ton of high-profile software: Linux and Git, deep learning frameworks, databases.
Golang
gfycat
A lot of cloud native stuff here.